FreshNews Market Snapshot
Dogecoin (DOGE)
-0.56% in the last 24 hours
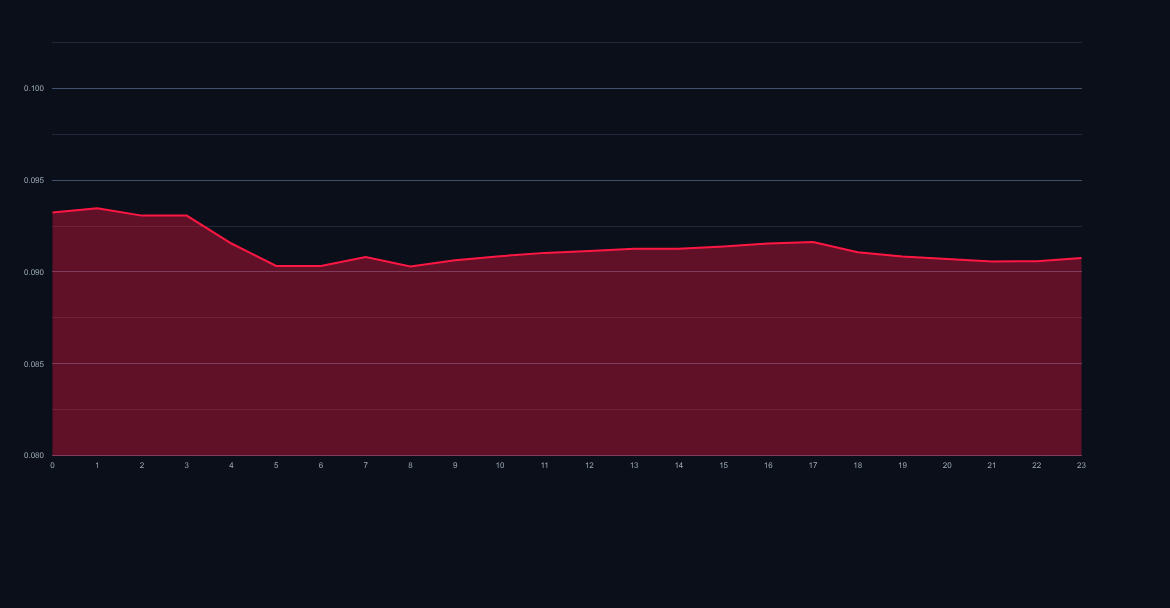
Price: $0.090760
24h High: $0.092110
24h Low: $0.090370
Bias: Cautious / bearish bias
 DOGEMar 07, 2026
Quick Take
DOGE price analysis starts with a simple read: sellers still control the short-term tone. Dogecoin is trading near $0.090760 after printing a -0.56% 24-hour move, so traders should focus on whether momentum can hold above recent support while testing the next resistance band.
Technical Snapshot
Support
$0.090370
Nearest level buyers need to defend
Pivot
$0.091080
Intraday balance area
Resistance
$0.092110
Immediate upside test zone
Bull Case
A rebound case builds only if DOGE quickly reclaims $0.091280 and sellers fail to press below recent lows.
Bear Case
If price breaks below $0.090370, the current downside pressure can extend toward the next support zone.
DOGE Technical Snapshot: Navigating Range-Bound Consolidation
The immediate trading session for Dogecoin (DOGE) reveals a continuation of tight, range-bound action, characterized by waning intraday volume following a slight negative drift. Currently priced around $0.090760, the asset is trading marginally below its opening print of $0.091280, reflecting a modest 0.56% dip over the last 24 hours. This DOGE price analysis focuses purely on near-term technical indicators relevant for short-term position adjustments.
Momentum indicators suggest a neutral-to-slightly-bearish tilt, though the overall structure remains compressed. Traders should monitor key psychological barriers as the market digests recent price action.
What Levels Define the Current Trading Range?
The market is currently exhibiting classic consolidation patterns, suggesting a build-up of energy before the next significant directional move. Identifying the boundaries of this range is crucial for tactical entry and exit planning.
- Immediate Resistance (R1): The recent high near $0.092110 acts as the first test. A decisive close above this level on increased volume would signal short-term bullish intent.
- Key Resistance (R2): Breaking R1 opens the door toward the psychological $0.0950 mark, which has historically acted as a significant inflection point.
- Immediate Support (S1): Current price action hovers near the $0.090370 low established in the last 24 hours. This area needs to hold firm.
- Critical Support (S2): A breach below $0.0900 (psychological support) invites a retest of the lower boundary of the consolidation zone, potentially testing levels near $0.0885.
Is a Breakout Imminent?
While consolidation is evident, the market lacks the necessary conviction for an immediate explosive move. The Bollinger Bands are tightening, which historically precedes volatility expansion. However, the current bearish intraday change suggests downside pressure is marginally favored in the immediate term.
For bullish scenarios to gain traction, we require sustained volume accumulation above $0.0925. Conversely, the Dogecoin outlook remains subdued if selling pressure forces a close beneath S2 ($0.0885).
What Do Oscillators Indicate?
The Relative Strength Index (RSI) is tracking near the 50 midline, confirming the indecisive nature of the current trading environment. There is no overbought or oversold condition present, allowing ample room for movement in either direction once the trigger occurs.
- Bearish Signal: A sustained move below 45 on the RSI, coupled with a price break below $0.0900, would confirm bearish continuation targeting lower support.
- Bullish Signal: A surge past 55 on the RSI, aligning with a clear break of $0.0930, suggests bulls are regaining control.
Where is Risk Management Best Applied?
Given the tight range, risk management protocols must be strictly adhered to. Short-term traders should utilize the established support and resistance levels as primary stop-loss placement areas.
For long positions initiated near the lower end of the range ($0.0900), stops should be placed just below the $0.0895 threshold to protect against stop-loss hunting that could rapidly target $0.0880.
For short positions aiming to capitalize on a breakdown, entry confirmation above $0.0925 invalidates the bearish thesis, demanding immediate exit.
FAQ
What is the immediate 24-hour trend sentiment?
The immediate 24-hour sentiment is marginally bearish, evidenced by the slight decline from the open and the failure to hold above $0.0915 during the Asian session.
Is $0.0900 a critical psychological level?
Yes, $0.0900 functions as a key psychological support level. A decisive break below this price point often triggers automated selling cascades in the short term.
What volume characteristic would confirm a breakout?
A confirming breakout, either up or down, requires volume spikes exceeding the 30-day average by at least 150% to validate the directional move away from current consolidation.