FreshNews Market Snapshot
Solana (SOL)
-0.33% in the last 24 hours
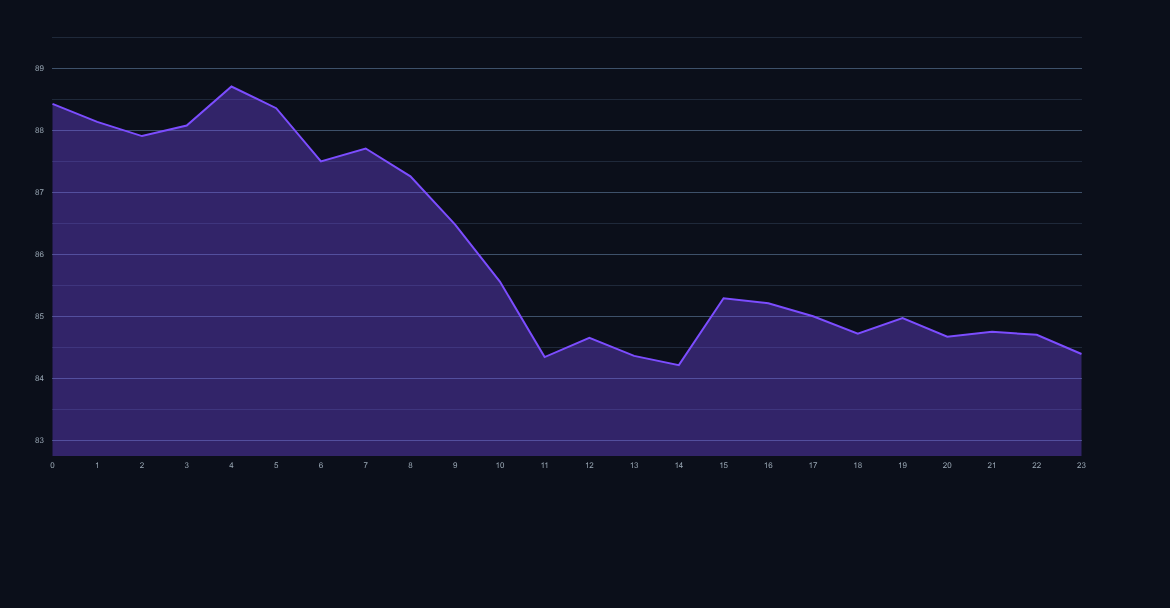
Price: $84.39
24h High: $85.07
24h Low: $84.31
Bias: Cautious / bearish bias
 Mar 07, 2026
Quick Take
SOL price analysis starts with a simple read: sellers still control the short-term tone. Solana is trading near $84.39 after printing a -0.33% 24-hour move, so traders should focus on whether momentum can hold above recent support while testing the next resistance band.
Technical Snapshot
Support
$84.31
Nearest level buyers need to defend
Pivot
$84.59
Intraday balance area
Resistance
$85.07
Immediate upside test zone
Bull Case
A rebound case builds only if SOL quickly reclaims $84.67 and sellers fail to press below recent lows.
Bear Case
If price breaks below $84.31, the current downside pressure can extend toward the next support zone.
Quick Summary
Solana (SOL) is currently trading near the $84.39 mark, reflecting a slight negative drift over the last 24 hours. Short-term momentum suggests caution, with intraday trading confined to a tight range just below the opening price of $84.67. This SOL price analysis focuses on immediate support testing and the necessary upside confirmation for sustained recovery.Market Overview
The $84.39 level represents a critical juncture for short-term traders. SOL opened the session at $84.67 and has since tested support down to $84.31, indicating selling pressure is currently outweighing buying interest on the immediate timeframe. The high of $85.07 established early in the session remains the immediate ceiling bulls must overcome to regain control. Trading volume remains steady but lacks the conviction required to break significant technical barriers decisively.Key Price Levels
For tactical traders, identifying precise support and resistance zones is paramount. Immediate support sits firmly at the 24-hour low of $84.31. A breach below this level on increased volume would signal a deeper retracement targeting the psychological $83.00 level, which acts as the next significant floor. Resistance begins immediately at the $84.75 area, representing intraday consolidation resistance. The primary hurdle for any bullish move is the session high established at $85.07. Clearing $85.07 is necessary to open the path toward the $86.50 resistance cluster, a level where selling pressure historically reappears.Technical Outlook
The short-term technical indicators reflect the current subdued price action. The moving averages are closely aligned, providing minimal directional bias, which is typical during periods of consolidation following recent volatility. RSI readings are hovering near the neutral 50 mark, suggesting neither overbought nor oversold conditions prevail, reinforcing the view that the market is awaiting a clear catalyst. Traders should monitor the 15-minute charts for divergence, as this often precedes short-term directional shifts in tight ranges.Bullish Scenario vs Bearish Scenario
The Solana outlook hinges on defending the current price area. The Bullish Scenario requires immediate rejection of the $84.31 support. A decisive close above $85.15 would confirm renewed buying interest, aiming for a quick test of $85.80. Sustained momentum above $86.00 would invalidate the current bearish drift. The Bearish Scenario materializes if the $84.31 support fails. A sustained move below $84.00 would likely invite stop-loss triggers, accelerating the decline toward the crucial $83.00 support zone. If $83.00 breaks, the short-term structure turns decidedly negative, potentially leading toward the $81.50 region.What to Watch Next
Traders must prioritize volume confirmation during any price movement away from the $84.30–$85.10 range. Low-volume breakouts are frequently unreliable. Market participants should be alert for any unexpected shifts in broader cryptocurrency sentiment, as SOL often correlates strongly with Bitcoin’s immediate movements. Maintaining vigilance around the $84.50 midpoint will indicate who controls the intraday narrative.FAQ
What is the immediate resistance level for SOL? The immediate resistance level is the 24-hour high established at $85.07; breaking this is crucial for upward momentum.
Is the current trend bullish or bearish? The current 24-hour change is negative, indicating short-term bearish momentum, though the price remains range-bound.