FreshNews Market Snapshot
Avalanche (AVAX)
0.08% in the last 24 hours
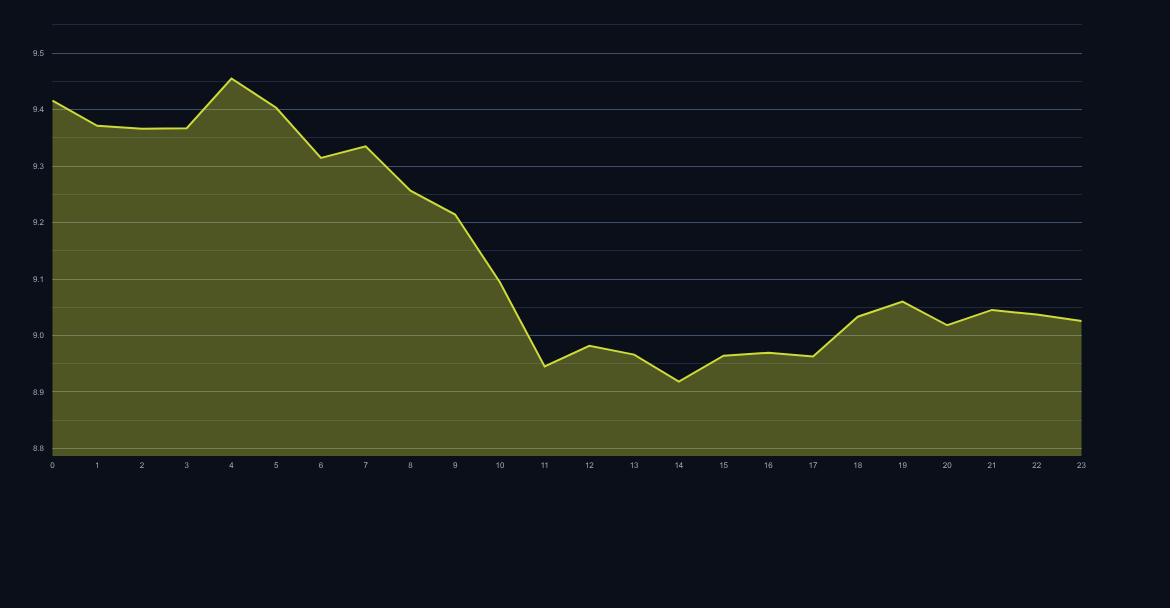
Price: $9.03
24h High: $9.06
24h Low: $9.01
Bias: Bullish intraday bias
 Mar 07, 2026
Quick Take
AVAX price analysis starts with a simple read: buyers remain active. Avalanche is trading near $9.03 after printing a 0.08% 24-hour move, so traders should focus on whether momentum can hold above recent support while testing the next resistance band.
Technical Snapshot
Support
$9.01
Nearest level buyers need to defend
Pivot
$9.03
Intraday balance area
Resistance
$9.06
Immediate upside test zone
Bull Case
Momentum stays constructive if AVAX holds above $9.01 and buyers keep reclaiming intraday pullbacks.
Bear Case
If price loses $9.02 after the recent move, short-term traders should expect slower follow-through and possible consolidation.
Quick Summary
Avalanche (AVAX) is exhibiting tight consolidation near the $9.00 mark following a recent dip in momentum. The current trading range suggests indecision among short-term participants. This AVAX price analysis focuses on immediate support and resistance boundaries critical for intraday and swing traders navigating the current choppy conditions.
Market Overview
AVAX is trading at $9.03, showing minimal movement from its opening price of $9.02. The 24-hour change reflects a slight upward drift, yet intraday volume suggests waning conviction. The high of $9.06 and low of $9.01 define a narrow $0.05 trading band over the last day, signaling a period of equilibrium following prior volatility.
For short-term traders, this consolidation phase is crucial. Breakouts from this tight range are likely to dictate the next directional move. Current market structure implies that buyers are defending the psychological $9.00 level, while sellers are capping rallies just above $9.06.
Key Price Levels
Identifying immediate support and resistance is paramount for tactical trading decisions. On the downside, the immediate support cluster sits between $8.95 and $9.00. A decisive breach below $8.95, confirmed by increased selling volume, would target the next significant support zone near $8.80, which represents a critical structural low from recent sessions.
Resistance is stacked immediately above the current trading range. The first hurdle is the recent high at $9.06. A sustained push above this level would challenge the intraday high-water mark established at $9.12. Clearing $9.15 would signal a potential short-term reversal of the recent bearish bias, potentially opening the door toward the $9.30 region.
Technical Outlook
Short-term indicators reflect the current sideways action. Moving averages are beginning to converge, indicating a reduction in short-term trend strength. Volume profile analysis shows that trading activity has diminished during this consolidation, often preceding a significant move.
Traders should monitor the Relative Strength Index (RSI) closely. If the RSI remains pinned near 50, it reinforces the neutral short-term outlook. A dip below 45 would confirm bearish dominance, while a sharp move above 55 would suggest renewed buying pressure entering the market.
Bullish Scenario vs Bearish Scenario
The bullish scenario hinges on the successful defense of the $9.00 psychological level. If buyers can absorb selling pressure around $8.95 and push AVAX decisively above $9.12, the market could re-test higher resistance levels. A confirmed break above $9.15 would be the catalyst for a short-term rally, potentially targeting $9.35 in the subsequent trading periods.
Conversely, the bearish scenario materializes if $8.95 fails to hold. A strong close below $8.90 would invalidate the current support structure. This breakdown would likely invite aggressive short positions targeting the $8.80 floor. If $8.80 breaks, the Avalanche outlook becomes significantly weaker, opening the possibility of a swift move toward the $8.65 support area.
What to Watch Next
Market participants should prioritize immediate volume changes. Any significant influx of buying volume accompanying a move above $9.08 will be a primary signal for bullish continuation. Conversely, high-volume selling below $8.92 will confirm the bearish tilt.
For short-term traders, maintaining strict stop-loss orders relative to the $8.95 support is crucial until a clear directional bias is established above $9.15.
FAQ
What is the immediate support level for AVAX?
The immediate support level traders are closely watching is the psychological $9.00 mark, with critical structural support identified at $8.95.
Is the current AVAX momentum bullish or bearish?
The 24-hour metrics suggest current momentum is slightly bearish, evidenced by the tight consolidation favoring the lower end of the recent range.
What price signals a potential short-term reversal to the upside?
A sustained close above $9.15, supported by increased trading volume, would signal a strong short-term reversal signal for AVAX.