Cardano Stalls at $0.25: Is ADA's Next Move Up or Down?
March 07, 2026
share
FreshNews Market Snapshot
Cardano (ADA)
-0.41% in the last 24 hours
Price: $0.257936
24h High: $0.260993
24h Low: $0.257090
Bias: Cautious / bearish bias
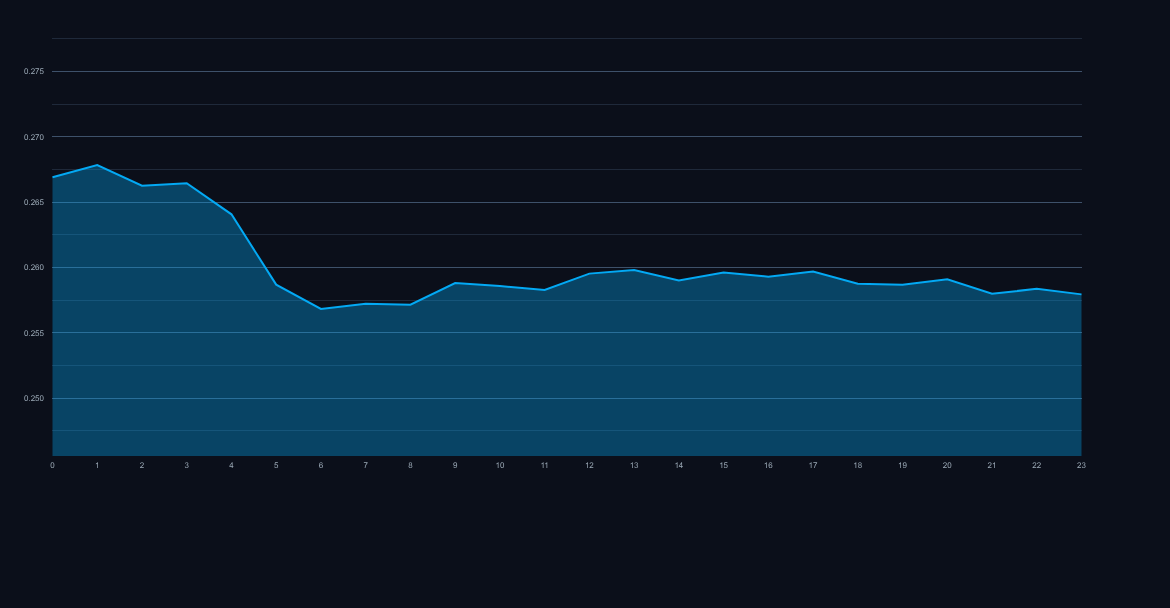
Crypto Outlook | ADA | $0.257936 | -0.41% 24hMar 07, 2026
ADA 24-hour chart, current price $0.257936, daily move -0.41%.
Quick Take
ADA price analysis starts with a simple read: sellers still control the short-term tone. Cardano is trading near $0.257936 after printing a -0.41% 24-hour move, so traders should focus on whether momentum can hold above recent support while testing the next resistance band.
Technical Snapshot
Support
$0.257090
Nearest level buyers need to defend
Pivot
$0.258673
Intraday balance area
Resistance
$0.260993
Immediate upside test zone
Bull Case
A rebound case builds only if ADA quickly reclaims $0.259173 and sellers fail to press below recent lows.
Bear Case
If price breaks below $0.257090, the current downside pressure can extend toward the next support zone.
ADA Price Action: Navigating Near-Term Consolidation
Cardano (ADA) continues to trade within a narrow band, reflecting broader market indecision following recent volatility. This ADA price analysis focuses on the immediate technical levels crucial for short-term traders assessing entry or exit points over the next 48 hours. The asset opened at $0.259173 and closed the last 24-hour cycle down 0.41%, settling near $0.257936.
Where is Immediate Support Located?
Momentum is decidedly skewed to the downside in the very short term, evidenced by the closing below the opening price. Traders are currently testing lower boundaries.
* **Immediate Support (S1):** $0.2570, coinciding with the recent 24-hour low. A decisive breach below this level signals further downside risk.
* **Key Structural Support (S2):** $0.2550. Holding this zone is critical to maintaining the current consolidation structure.
Is a Breakout Imminent?
Upside momentum remains constrained by immediate overhead resistance. The market needs a significant catalyst or accumulation phase to overcome these technical hurdles.
* **Immediate Resistance (R1):** $0.2615. This level represents the high of the recent trading range.
* **Target Resistance (R2):** $0.2640. Clearing this suggests bulls are regaining control, potentially targeting the $0.27 mark.
The current bearish tilt suggests selling pressure may test S1 before any significant upward move can be sustained.
What Does This Mean for the Cardano Outlook?
The current trading pattern suggests range-bound activity, characteristic of market digestion after a sharp move. For the near-term Cardano outlook, traders should prioritize risk management based on the defined support structure.
**Bullish Scenario:** A confirmed close above $0.2640 on increased volume would invalidate the immediate bearish bias, setting up a potential test of $0.2700.
**Bearish Scenario:** Sustained trading below $0.2550 forces a re-evaluation, potentially exposing lower support levels near $0.2500, which would signal a deeper corrective phase.
FAQ
What is the current 24-hour performance metric?
ADA registered a modest decline of approximately 0.41% over the last 24 hours, trading between a high of $0.260993 and a low of $0.257090.
Is the short-term trend bullish or bearish?
The immediate momentum favors the bears, as the price closed lower than its opening price, indicating intraday selling pressure remains dominant.
What price level is crucial for maintaining consolidation?
Traders are closely watching the $0.2550 zone; if ADA can hold this level, the current sideways trading pattern remains intact.
 Mar 07, 2026