FreshNews Market Snapshot
Solana (SOL)
-0.56% in the last 24 hours
Price: $84.20
24h High: $85.07
24h Low: $83.98
Bias: Cautious / bearish bias
 SOLMar 07, 2026
Quick Take
SOL price analysis starts with a simple read: sellers still control the short-term tone. Solana is trading near $84.20 after printing a -0.56% 24-hour move, so traders should focus on whether momentum can hold above recent support while testing the next resistance band.
Technical Snapshot
Support
$83.98
Nearest level buyers need to defend
Pivot
$84.42
Intraday balance area
Resistance
$85.07
Immediate upside test zone
Bull Case
A rebound case builds only if SOL quickly reclaims $84.67 and sellers fail to press below recent lows.
Bear Case
If price breaks below $83.98, the current downside pressure can extend toward the next support zone.
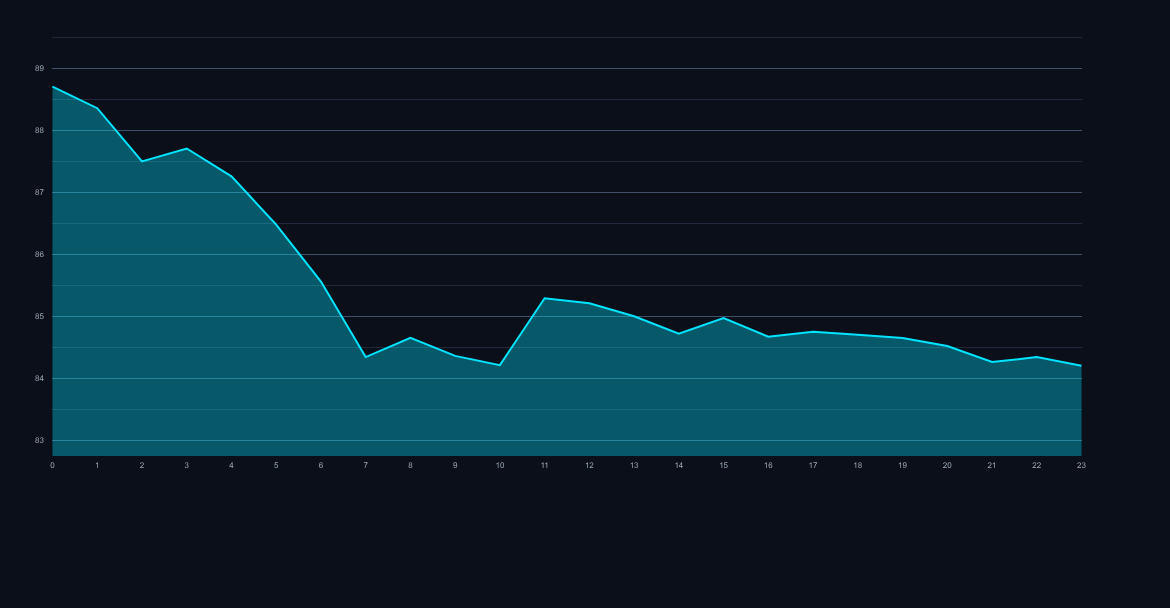
The Tape and the Technicals
Solana (SOL) is currently navigating a period of tight consolidation, with price action compressing within a narrow $1.09 range over the last 24 hours. After opening the session at $84.67, the asset has retreated to $84.20, marking a modest decline of approximately 0.55%. This SOL price analysis indicates that while the broader trend remains cautious, the immediate intraday volatility has remained relatively low, suggesting a buildup of pressure as the market tests local liquidity zones.
- Current Price: $84.20
- 24h High/Low: $85.07 / $83.98
- Opening Price: $84.67
- Percentage Change: -0.55%
- Immediate Support: $83.98 (Intraday Low)
- Immediate Resistance: $85.07 (Intraday High)
Bulls vs Bears: The Battle for $85
The short-term technical landscape is currently skewed toward the bears, as SOL remains pinned below the $85.00 psychological threshold. For the bearish thesis to gain further traction, sellers need to force a decisive break below the 24-hour low of $83.98. A breach of this support level could trigger a liquidation cascade toward the $81.50 zone. Momentum indicators suggest that buying volume is currently insufficient to absorb sell-side pressure at the $84.80 level, keeping the asset in a defensive posture.
Conversely, the bullish scenario hinges on reclaiming the daily high of $85.07. If buyers can flip this level from resistance to support, it would negate the immediate bearish momentum and open the door for a retest of the $86.50 supply zone. Short-term traders should monitor the $84.50 pivot point; staying above this level is essential for any intraday recovery attempts. However, with the current 24-hour momentum trending downward, the path of least resistance appears to be a retest of the lower support bounds.