FreshNews Market Snapshot
Ethereum (ETH)
-0.16% in the last 24 hours
Price: $1975.57
24h High: $1996.37
24h Low: $1964.21
Bias: Cautious / bearish bias
 ETHMar 07, 2026
Quick Take
ETH price analysis starts with a simple read: sellers still control the short-term tone. Ethereum is trading near $1975.57 after printing a -0.16% 24-hour move, so traders should focus on whether momentum can hold above recent support while testing the next resistance band.
Technical Snapshot
Support
$1964.21
Nearest level buyers need to defend
Pivot
$1978.72
Intraday balance area
Resistance
$1996.37
Immediate upside test zone
Bull Case
A rebound case builds only if ETH quickly reclaims $1979.19 and sellers fail to press below recent lows.
Bear Case
If price breaks below $1964.21, the current downside pressure can extend toward the next support zone.
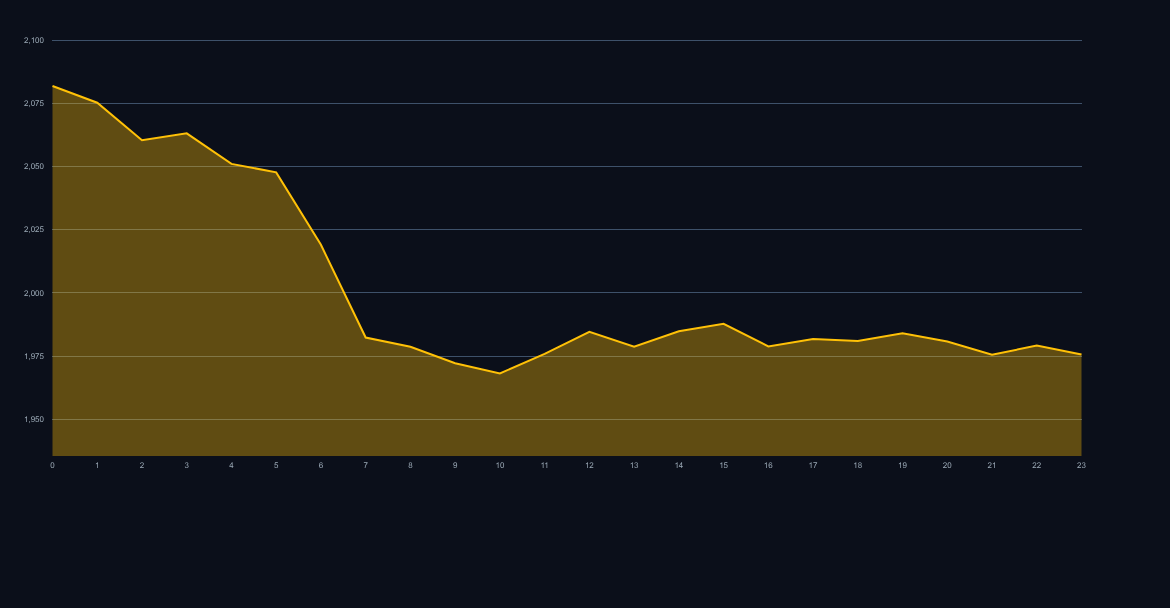
Ethereum: Holding the Line Near $2,000—What’s Next?
The current trading session for Ethereum (ETH) is showing palpable tension. Hovering just beneath the psychologically significant $2,000 mark, the market is consolidating after a volatile swing that saw the asset open at $1979.19 and test highs near $1996.37. The immediate 24-hour performance reflects a slight dip, currently sitting at $1975.57, marking a -0.16% retraction. This latest ETH price analysis suggests traders are awaiting a definitive catalyst to break the current stalemate.
Is the $2,000 Ceiling Too Strong?
The psychological barrier at $2,000 continues to exert significant gravitational pull. While bulls managed to push above this level intraday, the inability to sustain momentum is concerning for aggressive long positions. We are seeing strong selling pressure materialize immediately upon approach to $2,000, indicating significant profit-taking or short entry points being activated.
Key observations from the recent price action:
- Intraday High Failure: The inability to close firmly above $2,000 on the daily chart is a bearish signal in the very short term.
- Volume Profile: Trading volume appears relatively muted during this consolidation phase, suggesting institutional players may be on the sidelines waiting for a clearer directional bias.
- Low Test: The intraday low of $1964.21 confirms that support is being actively tested, yet major liquidation hasn't occurred yet.
Where is Immediate Support Located?
For short-term traders, identifying the immediate downside risk is crucial. We are currently defending the lower end of the consolidation range, but breaches below key technical levels will trigger stop-losses.
The primary support structure rests in a tight band:
- Immediate Floor: The $1960 level must hold. A decisive break below $1960 opens the door for a quick descent toward the $1945-$1950 zone, which represents the last significant area of buying interest from the previous 48 hours.
- Critical Line in the Sand: Failure to hold $1945 would seriously undermine the current bullish structure, potentially targeting the $1900 psychological anchor point.
The fact that the price opened near $1979 and is now trading slightly lower confirms the bearish bias dominating the immediate 24-hour metrics.
What Triggers the Next Major Move?
The market needs conviction. Whether that conviction comes from sustained buying volume pushing past $2,000 or heavy selling pressure breaking $1960 will define the next significant swing.
Bullish Case: The Path Back to Resistance
For bulls to regain control, the $2,000 level must be conquered and held as new support. The next target after a successful retest of $2,000 is the recent swing high resistance, likely situated around $2,015 to $2,025. If momentum accelerates past $2,025 on high volume, the market could quickly re-engage with the $2,050 region, invalidating the recent bearish pullback.
Bearish Case: Risk of Deeper Correction
If selling pressure intensifies and the $1960 support fails, the bearish scenario gains traction. Traders should watch for momentum indicators (like RSI or MACD) confirming divergence on the hourly charts if the price drifts lower. A move toward $1900 would signal a deeper consolidation phase, possibly lasting several days before another attempt at the $2k ceiling.
What Does the Ethereum Outlook Suggest Now?
The immediate Ethereum outlook is one of cautious indecision, favoring sellers slightly due to the current negative 24-hour percentage change. Traders should treat the $1960-$2000 range as the key battleground for the next 12-24 hours. Aggressive positioning should wait for a confirmed break above $2,005 or a decisive rejection below $1955. Until then, range-bound trading or reduced exposure remains the prudent strategy for risk management.
FAQ
What is the most critical resistance level right now?
The most immediate and psychologically significant resistance level is precisely $2,000. Overcoming and holding this level is paramount for bulls to initiate any significant upward continuation.
If ETH drops below $1950, where should traders look for stability?
If the $1950 area is breached, the next major stabilizing zone traders will be watching closely is the $1900 psychological marker, which has historically provided strong buying interest during minor pullbacks.
Is the current negative 24h change a major concern?
No, not in isolation. A marginal -0.16% change within a tight consolidation range near a major psychological barrier is common noise, but it does confirm that immediate momentum favors sellers slightly over buyers.