FreshNews Market Snapshot
Bitcoin (BTC)
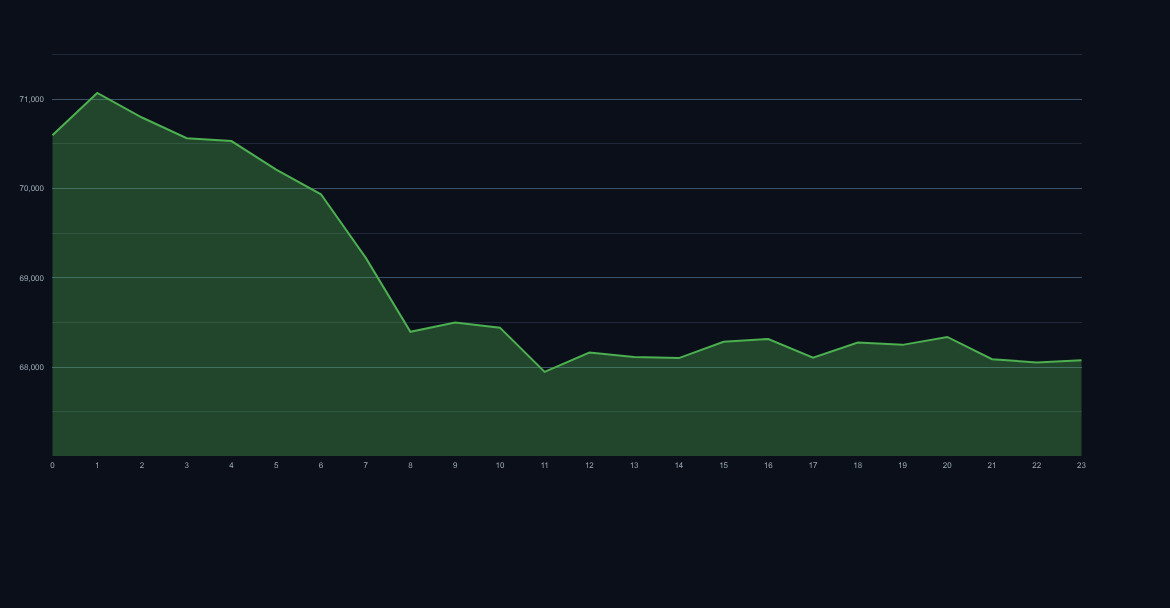
-0.04% in the last 24 hours
Price: $68080.18
24h High: $68544.79
24h Low: $67803.01
Bias: Cautious / bearish bias
 BTCMar 07, 2026
Quick Take
BTC price analysis starts with a simple read: sellers still control the short-term tone. Bitcoin is trading near $68080.18 after printing a -0.04% 24-hour move, so traders should focus on whether momentum can hold above recent support while testing the next resistance band.
Technical Snapshot
Support
$67803.01
Nearest level buyers need to defend
Pivot
$68142.66
Intraday balance area
Resistance
$68544.79
Immediate upside test zone
Bull Case
A rebound case builds only if BTC quickly reclaims $68108.23 and sellers fail to press below recent lows.
Bear Case
If price breaks below $67803.01, the current downside pressure can extend toward the next support zone.
Can Bulls Reclaim the Daily Open?
Bitcoin is currently grappling with minor intraday selling pressure, oscillating around the $68,080.18 mark. This BTC price analysis examines the technical landscape after a sessionRelated BTC Coverage