US Dollar / Indian Rupee (USDINR) Price Analysis – 0.06% Outlook
March 07, 2026
share
FreshNews Market Snapshot
US Dollar / Indian Rupee (USDINR)
0.06% in the last 24 hours
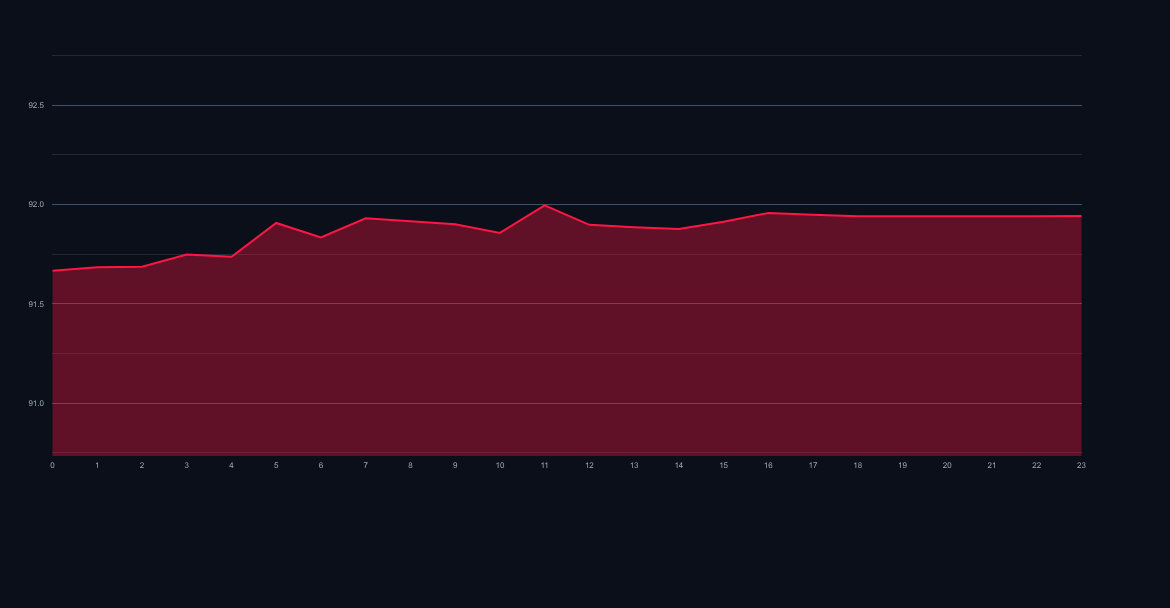
Price: 91.94123
24h High: 92.01568
24h Low: 91.83590
Bias: Bullish intraday bias
USDINRMar 07, 2026
USDINR 24-hour chart, current price 91.94123, daily move 0.06%.
Quick Take
USDINR price analysis starts with a simple read: buyers remain active. US Dollar / Indian Rupee is trading near 91.94123 after printing a 0.06% 24-hour move, so traders should focus on whether momentum can hold above recent support while testing the next resistance band.
Technical Snapshot
Support
91.83590
Nearest level buyers need to defend
Pivot
91.93094
Intraday balance area
Resistance
92.01568
Immediate upside test zone
Bull Case
Momentum stays constructive if USDINR holds above 91.83590 and buyers keep reclaiming intraday pullbacks.
Bear Case
If price loses 91.88246 after the recent move, short-term traders should expect slower follow-through and possible consolidation.
USDINR Price Action Review: Navigating the Current Range
The USDINR pair is trading at 91.94123, reflecting a modest intraday gain of 0.061348518% from its open near 91.88246. This recent move has pushed the exchange rate toward established short-term resistance levels. This USDINR price analysis focuses strictly on the technical positioning for short-term market participants.
Is a Definitive Breakout Underway?
The high of 92.01568 represents the immediate ceiling. A decisive close above this level, sustained for at least four consecutive hourly candles, would signal a renewed bullish push, potentially targeting the 92.15 area. Conversely, failure to breach 92.02 suggests consolidation within the current band. The 24-hour momentum indicators currently lean slightly positive, but volume confirmation remains key for a sustained upward trajectory.
Where is Immediate Support Situated?
The intraday low printed at 91.83590 is the first line of defense for the bulls. More critical, however, is the psychological and recent congestion zone around 91.8800. A drop below the opening price of 91.88246 and a subsequent close under 91.8500 would invalidate the immediate bullish bias. Such a bearish move would likely invite selling pressure toward the 91.70 support cluster.
What Does the US Dollar / Indian Rupee Outlook Suggest for H4?
For the immediate short term, the path of least resistance appears marginally upward, provided 91.90 holds as a pivot point. Traders should monitor the reaction to 92.02. A rejection here confirms range-bound trading between 91.85 and 92.02. A break above 92.02 opens the door for a potential 0.20% move higher, whereas a failure to hold 91.85 suggests a downside test toward 91.75 within the next trading session. Precision in these technical boundaries dictates short-term positioning.
FAQ
What is the primary resistance level to watch today?
The immediate technical resistance level is established at 92.01568, corresponding to the intraday high; a sustained breach is required for further upside.
If the pair retreats, where is the first key support zone?
The first significant support zone lies between 91.8800 and 91.8500, derived from the opening price and recent congestion lows.
Is the current momentum strongly bullish or neutral?
Momentum is slightly bullish based on 24-hour metrics, but the pair remains constrained by near-term resistance, suggesting a cautious, near-neutral bias until a clear breakout occurs.
 USDINRMar 07, 2026