New Zealand Dollar / US Dollar (NZDUSD) Price Analysis – -0.03% Outlook
March 07, 2026
share
FreshNews Market Snapshot
New Zealand Dollar / US Dollar (NZDUSD)
-0.03% in the last 24 hours
Price: 0.59000
24h High: 0.59058
24h Low: 0.58946
Bias: Cautious / bearish bias
NZDUSDMar 07, 2026
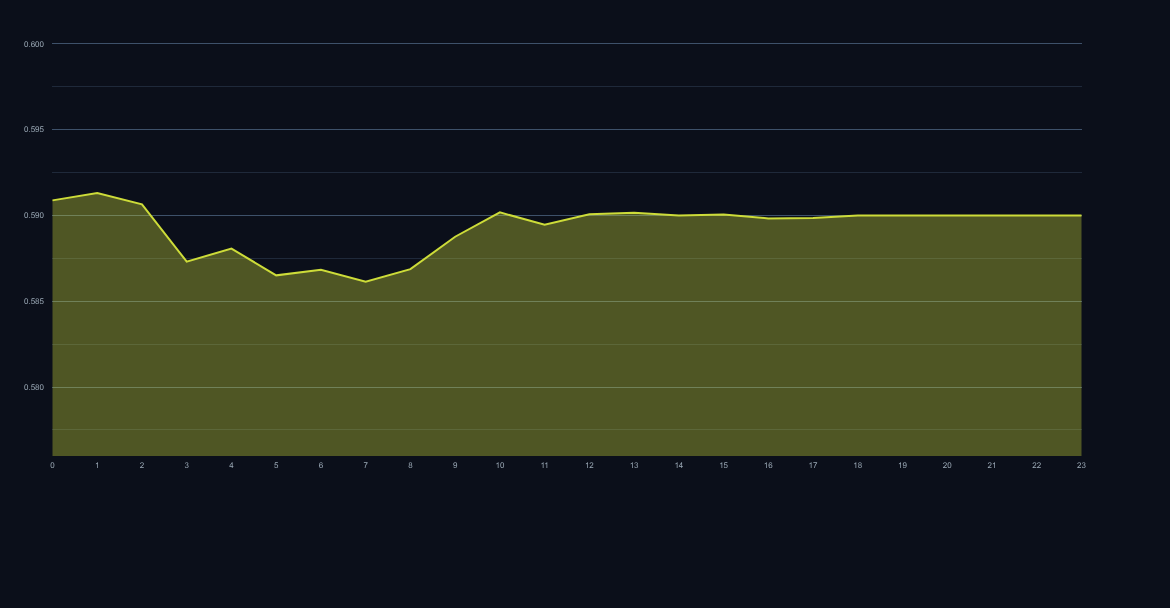
NZDUSD 24-hour chart, current price 0.59000, daily move -0.03%.
Quick Take
NZDUSD price analysis starts with a simple read: sellers still control the short-term tone. New Zealand Dollar / US Dollar is trading near 0.59000 after printing a -0.03% 24-hour move, so traders should focus on whether momentum can hold above recent support while testing the next resistance band.
Technical Snapshot
Support
0.58946
Nearest level buyers need to defend
Pivot
0.59001
Intraday balance area
Resistance
0.59058
Immediate upside test zone
Bull Case
A rebound case builds only if NZDUSD quickly reclaims 0.59017 and sellers fail to press below recent lows.
Bear Case
If price breaks below 0.58946, the current downside pressure can extend toward the next support zone.
Navigating the Consolidation Zone in NZDUSD
The New Zealand Dollar / US Dollar pair (NZDUSD) is currently trading precariously near the 0.5900 psychological level, reflecting a period of indecision following recent downside pressure. This NZDUSD price analysis focuses on the immediate technical landscape for short-term traders, emphasizing the need for patience until a clearer directional bias emerges. The slight negative drift over the last 24 hours, despite a relatively tight trading range, suggests that sellers retain a marginal edge in intraday action. Prudent risk management dictates waiting for a firm break above or below established technical barriers before committing significant capital.
Technical Outlook: Range-Bound Tension
On the daily chart perspective, NZDUSD remains trapped within a well-defined, albeit wide, consolidation pattern established over the past several trading sessions. The current price action around 0.5900 tests the mid-range equilibrium. Moving averages are converging, flattening out, which visually confirms the lack of strong trend conviction. For the immediate term, the pair appears to be respecting short-term downward sloping trendlines drawn from recent highs, keeping the ceiling relatively low for any bullish attempt.
Key Levels: Establishing Immediate Boundaries
Defining clear support and resistance levels is paramount for tactical positioning. Immediate resistance rests firmly at the recent intraday high of 0.59058. A decisive breach above this level, ideally sustained above 0.5915, would signal a tactical re-test of the minor swing high near 0.5930. Conversely, the immediate support structure is fragile. The 24-hour low at 0.58946 provides the first line of defense. Should this level give way, the next significant downside target for bearish continuation would be the psychological 0.5880 mark, followed by the more substantial support zone near 0.5865. Traders should monitor volume accompanying any break of these levels for confirmation.
Momentum Check: Fading Bullish Energy
Oscillator readings suggest that the recent bullish attempts have lost significant steam. The Relative Strength Index (RSI) on the hourly charts is hovering just below the 50 centerline, indicating neutral to slightly negative momentum, aligning with the daily price decline. While not yet oversold, the lack of upward acceleration suggests that any rallies are likely to be short-lived and met with selling interest near resistance. The Moving Average Convergence Divergence (MACD) is showing tightening lines, poised either to cross into bearish territory or fail to cross above the zero line, reinforcing the theme of consolidation under duress.
New Zealand Dollar / US Dollar Outlook: Scenarios for the Week Ahead
The New Zealand Dollar / US Dollar outlook hinges entirely on the resolution of the current 0.5900 impasse.
The Bearish Scenario requires a firm close below 0.5890 on an hourly basis. This would confirm the intraday bearish bias and likely target the 0.5865 area. A break below 0.5865 opens the door to more aggressive downside targets toward 0.5840, which represents a critical technical floor.
The Bullish Scenario remains contingent on reclaiming and holding 0.5915. A successful move above this threshold would suggest that the recent selling pressure was merely a retracement within a broader upward structure. However, given the current technical inertia, this scenario requires greater buying conviction than currently observed.
For short-term traders, maintaining a neutral stance or employing range-trading strategies with tight stop-losses around the 0.5890/0.5910 zone remains the most cautious approach until market participants decide on the next sustained directional move.
FAQ
What is the most critical immediate level for NZDUSD?
The 0.59058 high acts as immediate resistance, while 0.58946 is the crucial intraday support level to watch for directional confirmation.
Are the current indicators suggesting a trend reversal?
No, the indicators are currently signaling consolidation or a mild bearish bias within a defined range; they do not yet confirm a sustained trend reversal in either direction.
What should traders do if the price breaks below 0.5880?
A break below 0.5880 suggests the bearish scenario is gaining traction, warranting tighter risk management or potentially initiating tactical short positions targeting the 0.5865 floor.
 NZDUSDMar 07, 2026