FreshNews Market Snapshot
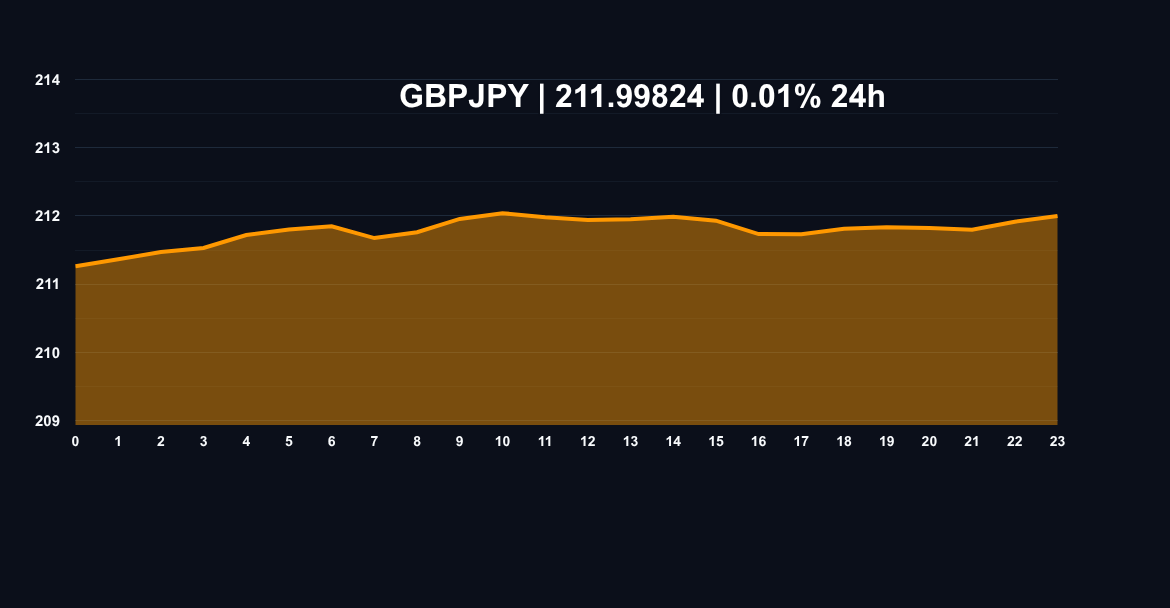
British Pound / Japanese Yen (GBPJPY)
0.01% in the last 24 hours
Price: 211.99824
24h High: 212.07681
24h Low: 211.59767
Bias: Bullish intraday bias
 Mar 10, 2026
Quick Take
GBPJPY price analysis starts with a simple read: buyers remain active. British Pound / Japanese Yen is trading near 211.99824 after printing a 0.01% 24-hour move, so traders should focus on whether momentum can hold above recent support while testing the next resistance band.
Technical Snapshot
Support
211.59767
Nearest level buyers need to defend
Pivot
211.89091
Intraday balance area
Resistance
212.07681
Immediate upside test zone
Bull Case
Momentum stays constructive if GBPJPY holds above 211.59767 and buyers keep reclaiming intraday pullbacks.
Bear Case
If price loses 211.96536 after the recent move, short-term traders should expect slower follow-through and possible consolidation.
Macro Snapshot: Consolidation Amidst Minor Upward Drift
The GBPJPY pair is exhibiting tight consolidation within its recent range, maintaining a fractional bullish bias supported by the 24-hour metrics. Current trading around 211.99824 suggests market participants are testing upper boundaries following yesterday's low near 211.59767. This GBPJPY price analysis focuses on immediate technical hurdles crucial for short-term positioning.
What the Charts Are Saying
Momentum remains positive but subdued, evidenced by the minimal 0.0087% gain observed since the session open at 211.96536. Price action is currently hovering just below the 24-hour high of 212.07681, indicating immediate overhead resistance.
- Immediate Resistance: The primary near-term ceiling is anchored at the 212.10 psychological level, with a more significant technical barrier residing near 212.35. Breaching 212.35 would signal renewed aggressive buying.
- Key Support Zones: Downside protection is currently forming around the 211.70 mark. A decisive break below this point would expose the session low area near 211.59. Further downside risk materializes if 211.40 is decisively violated.
- Volatility Profile: The range traded over the last 24 hours has been narrow (approximately 48 basis points), suggesting intraday traders should anticipate potential volatility spikes upon breaking established short-term levels.
Bulls vs Bears
The bullish scenario hinges on clearing 212.10 efficiently. If buyers can sustain pressure above 212.15, targets shift immediately toward 212.50, offering a quick 50-pip opportunity for aggressive long positions. Conversely, the bearish case requires a failure to hold 211.70. A sustained move below 211.50 would invalidate the current short-term positive structure, potentially initiating a corrective move toward 211.00.
The Road Ahead
For the immediate British Pound / Japanese Yen outlook, the pair is balanced precariously between short-term support and resistance clusters. Traders should prioritize adherence to risk management protocols, utilizing the 211.50 level as a critical stop-loss trigger for long exposure initiated near current prices.
FAQ
What is the most critical resistance level right now?
The 212.10 level acts as the immediate hurdle, but the more significant technical test for sustained upward movement is positioned near 212.35.
Where is the immediate downside support located?
Support is currently clustered around 211.70. A failure to maintain this price point suggests a retest of the session low area around 211.59.
Is the current trend strongly bullish or neutral?
The 24-hour change suggests a minor bullish bias, but the tight trading range indicates the market is largely neutral, awaiting a catalyst to break the 212.10 ceiling.