USDJPY Creeps Higher: Is 158 the Next Stop for the Dollar?
March 09, 2026
share
FreshNews Market Snapshot
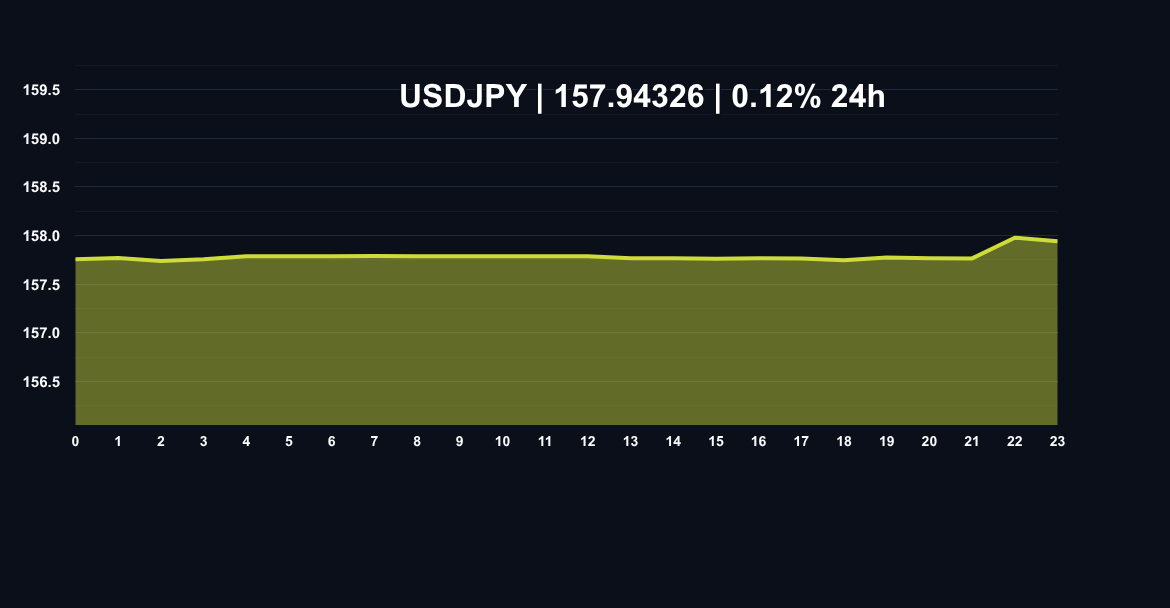
US Dollar / Japanese Yen (USDJPY)
0.12% in the last 24 hours
Price: 157.94326
24h High: 158.21768
24h Low: 157.64107
Bias: Bullish intraday bias
Mar 09, 2026
USDJPY 24-hour chart, current price 157.94326, daily move 0.12%.
Quick Take
USDJPY price analysis starts with a simple read: buyers remain active. US Dollar / Japanese Yen is trading near 157.94326 after printing a 0.12% 24-hour move, so traders should focus on whether momentum can hold above recent support while testing the next resistance band.
Technical Snapshot
Support
157.64107
Nearest level buyers need to defend
Pivot
157.93400
Intraday balance area
Resistance
158.21768
Immediate upside test zone
Bull Case
Momentum stays constructive if USDJPY holds above 157.64107 and buyers keep reclaiming intraday pullbacks.
Bear Case
If price loses 157.75712 after the recent move, short-term traders should expect slower follow-through and possible consolidation.
USDJPY: Navigating Elevated Volatility Near Multi-Decade Peaks
The USDJPY pair continues its ascent, consolidating near the critical 158.00 threshold following a robust session that pushed the high to 158.21768. This latest move reinforces the prevailing uptrend, making a comprehensive USDJPY price analysis essential for short-term participants managing risk exposure. Momentum indicators suggest continued upward bias, though proximity to historical highs warrants caution regarding potential mean reversion. Current trading activity is centered around 157.94326, building upon the day's opening print of 157.75712.
What the Charts Are Saying: Momentum Indicators Flashing Red
From a technical perspective, the daily chart remains decisively bullish, characterized by a series of higher highs and higher lows. However, the Relative Strength Index (RSI) is now firmly entrenched in overbought territory, typically signaling an exhaustion phase is imminent or that a significant consolidation period is required before the next major leg up. The 14-day RSI sits elevated, demanding attention from tactical traders.
Price action is currently trading well above all primary short-term moving averages (SMA 10, SMA 20), suggesting strong short-term conviction. The immediate overhead resistance cluster is centered around the 158.30 level, which represents the high print from late April. A decisive breach above this level, sustained on significant volume, would open the pathway toward the psychological 160.00 handle—a level not seen since the early 1990s.
Key Support and Resistance Architecture
Immediate support is observed at the prior consolidation zone near 157.60. A break below this level would likely trigger a test of the 157.25 area, which aligns closely with a short-term ascending trendline drawn from the recent lows. Should selling pressure overwhelm the market, the 156.80 level serves as a more substantial floor; failure to hold this suggests a deeper retracement to the 155.50 region.
Bulls vs Bears: The Tug of War at Altitude
The bullish case remains predicated on the significant yield differential maintained between US Treasury yields and Japanese Government Bonds (JGBs). As long as this divergence persists, the fundamental tailwind supporting USDJPY remains firmly in place. Bulls are looking to use any minor dips toward 157.50 as accumulation points, targeting the aforementioned 158.30 resistance breakout.
The bearish counter-narrative hinges entirely on market positioning and potential intervention risk. Given the rapid ascent, the market is highly leveraged long. A sudden shift in risk appetite, or any indication from Japanese authorities regarding FX stabilization measures (even verbal intervention), could lead to rapid unwinding. A failure to hold 157.25 would confirm short-term bearish momentum, potentially leading to a swift drop toward 156.50 as stop-loss orders are triggered.
The Road Ahead: US Dollar / Japanese Yen Outlook
The near-term trajectory for the US Dollar / Japanese Yen outlook remains skewed to the upside, contingent upon stability in global risk sentiment and the continued strength of the US Dollar Index (DXY). For intraday traders, maintaining tight stops is paramount given the elevated volatility profile. Scalping strategies focused on the 157.70 to 158.10 range offer the highest probability of short-term gains, provided the 157.60 support holds firm. Any move below 157.40 signals a necessary de-risking event for current long positions. The market is currently testing the upper band of its recent Bollinger Band expansion, suggesting a contraction or sharp move is due shortly.
FAQ
What is the critical psychological level traders are watching currently?
Traders are intently focused on the 158.00 mark. A sustained close above this level validates the current bullish impulse and sets sights on the 160.00 objective.
Where is the nearest technical support zone for USDJPY?
Immediate technical support resides near 157.60, followed by a more robust floor around 157.25, derived from recent trendline continuity.
What factor poses the greatest immediate risk to the current uptrend?
The primary immediate risk is the potential for sharp profit-taking due to the extremely overbought conditions indicated by momentum oscillators.
 Mar 09, 2026